
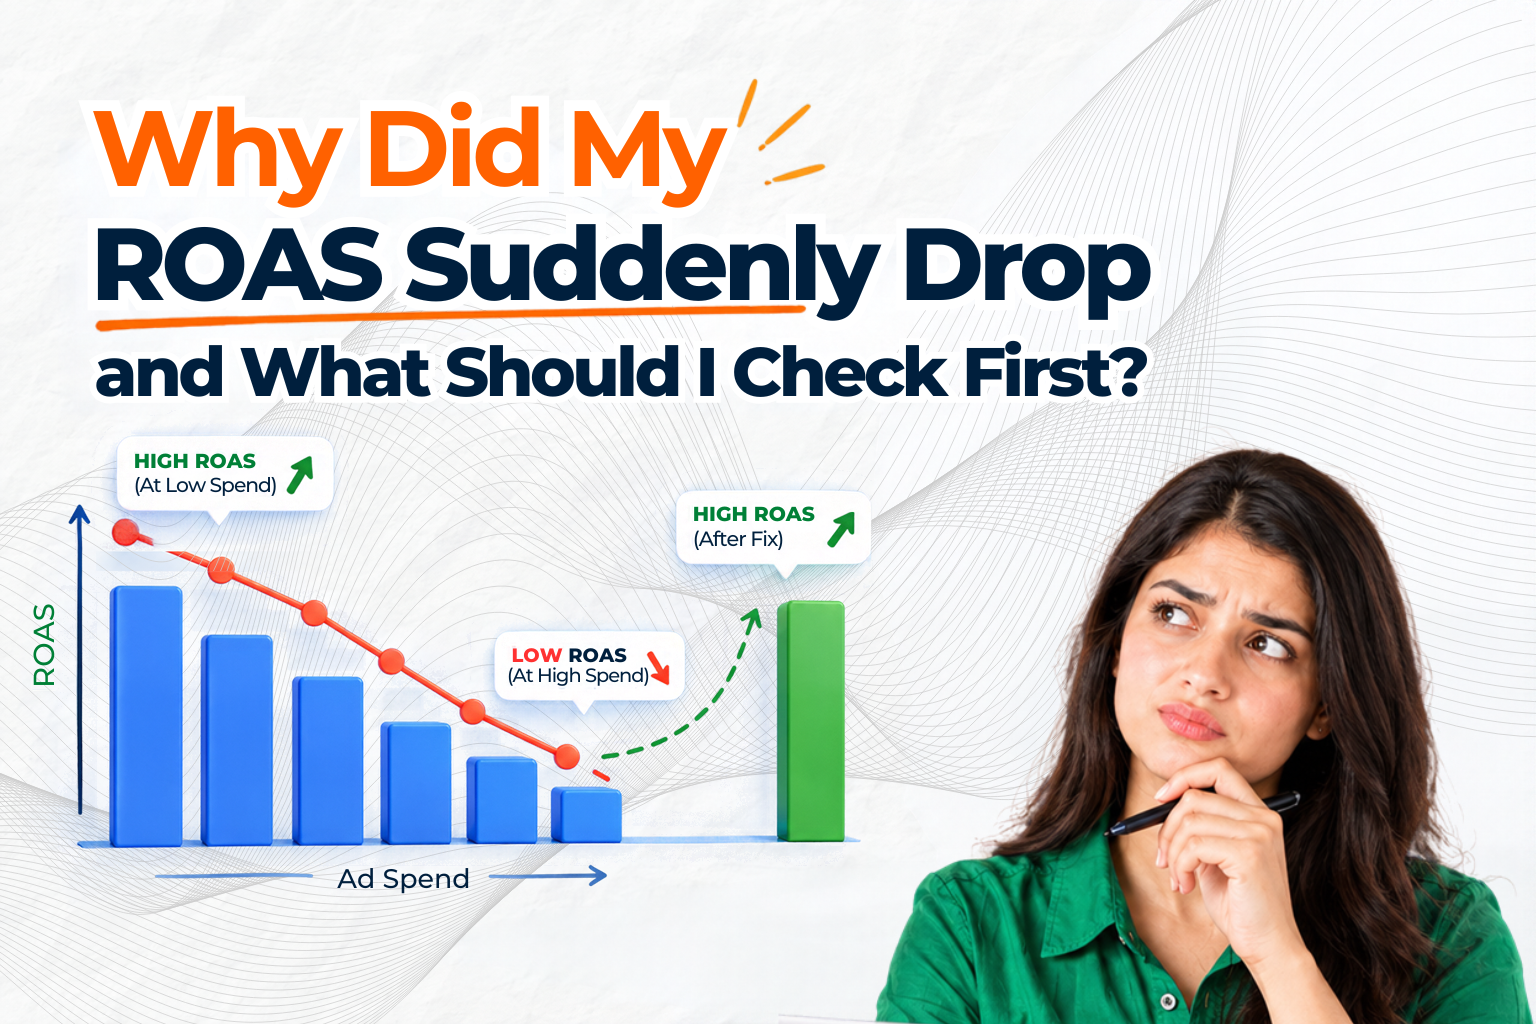
Why Did My ROAS Suddenly Drop and What Should I Check First?
Web D School | Expert Economy
A sudden ROAS drop can make marketers assume that a campaign is broken, the creative has stopped working, or the budget needs to be cut immediately. But a falling ROAS does not automatically mean your advertising became worse.
ROAS can drop because of changes in spend, conversion rate, average order value (AOV), audience quality, traffic costs, product mix, seasonality, discounts, or even tracking and attribution.
That is why the first question should not be, “What should I change?” It should be:
“What actually changed?”
A useful way to diagnose a falling ROAS is the SPARK framework: Spot, Probe, Adapt, Reconstruct, and Keep Iterating. It helps separate what you know from what you assume and prevents marketers from making several changes before identifying the real cause.
Here are the 7 things to check first when ROAS suddenly drops.
1. Check Whether Ad Spend Increased Faster Than Revenue
The first thing to investigate is the relationship between ad spend and attributed revenue.
ROAS is calculated as:
ROAS = Revenue Attributed to Ads ÷ Ad Spend
For example:
- Previous spend: ₹1,00,000
- Previous attributed revenue: ₹3,20,000
- Previous ROAS: 3.2x
After increasing the budget:
- New spend: ₹1,80,000
- New attributed revenue: ₹4,32,000
- New ROAS: 2.4x
Revenue increased, but it did not increase proportionately to spending.
This distinction matters. Increasing the budget does not automatically reduce ROAS. ROAS falls when the additional spend fails to generate enough additional revenue. Understanding how campaign scaling, audience targeting, creative performance, and conversion rates work together is essential for making better advertising decisions. This is where the expertise of a Full Stack Digital Marketer becomes invaluable; they can build a broader understanding of these cross-functional areas and evaluate campaign performance far beyond a single, isolated ROAS number. To help you master these dynamics, check out our comprehensive ROAS blog for deeper strategic insights.
What to check
Ask:
- Did the budget increase recently?
- Did revenue increase at the same rate?
- Did the additional budget enter new audiences?
- Did acquisition costs increase after scaling?
- Did incremental revenue justify the additional spend?
A lower ROAS after scaling may reflect reduced efficiency in the additional traffic rather than a completely broken campaign.
2. Check If Your Conversion Rate Dropped
If people are still clicking your ads but fewer of them are purchasing, the problem may be happening after the click.
For example:
- CTR remains stable
- CPC remains relatively stable
- Conversion rate falls from 3.5% to 1.8%
- ROAS falls
In this situation, immediately replacing the creative may not address the actual problem.
The advertising may still be generating interest. Something further down the funnel may have changed.
Check your:
- Landing page
- Product page
- Checkout process
- Offer
- Delivery information
- Payment options
- Website speed
- Mobile experience
- Stock availability
- Customer trust signals
A simple diagnostic question is:
“Are people refusing to click, or are they clicking but refusing to buy?”
That distinction can dramatically change what you investigate next.
3. Check Whether Your Average Order Value Fell
ROAS can decline even when the conversion rate looks relatively healthy if customers are spending less per order.
Suppose customers previously spent an average of ₹800 but the average order value falls to ₹740.
That means each converted customer generates less revenue.
A decline in AOV can happen because:
- Customers are buying cheaper products.
- Higher-priced products are out of stock.
- Discounts have become more aggressive.
- Customers are purchasing fewer items.
- Product mix has changed.
- Bundles are no longer performing.
- New customers have different purchasing behaviour.
This is why conversion rate alone is not enough to diagnose ROAS.
Check both:
Conversion rate → Are more or fewer people buying?
AOV → How much is each buyer spending?
4. Check Whether CPC or CPM Increased
Sometimes the problem starts before the customer even reaches your website.
If CPC (cost per click) or CPM (cost per 1,000 impressions) increases, the same amount of advertising budget can buy less traffic.
For example, increased competition may push CPM higher. A broader audience or more expensive placements can also increase traffic costs.
Check for changes in:
- CPC
- CPM
- CTR
- Frequency
- Audience size
- Placement mix
- Competition
- Campaign targeting
A useful pattern to look for is:
CPM ↑ → CPC ↑ → Traffic becomes more expensive → Acquisition cost ↑ → ROAS ↓
But don’t assume that sequence is the cause until the data supports it.
5. Check Whether Your Audience Became Colder
Audience temperature is one of the most important factors when diagnosing ROAS.
A campaign targeting people who already know your brand will often behave differently from one targeting people who have never encountered it.
Think of audiences in three broad groups:
Hot audience
Examples:
- Cart abandoners
- Recent website visitors
- Brand-name searchers
- Highly engaged users
These users already have strong purchase intent, so they can produce relatively high ROAS.
Warm audience
Examples:
- Previous website visitors
- Video viewers
- Social media engagers
- Email subscribers
They know something about the brand but may still need persuasion.
Cold audience
Examples:
- New prospects
- Broad audiences
- People unfamiliar with the brand
They generally require more education and persuasion before purchasing.
Why this matters
Imagine a campaign moves from mostly retargeting to a much larger prospecting audience.
ROAS may fall. That does not automatically mean the campaign became ineffective. The campaign is now doing a different job and reaching people with a different level of purchase intent. Therefore, do not compare prospecting and retargeting campaigns solely by their headline ROAS.
Understanding how these stages work is an important part of managing performance marketing. This is exactly where a Full Stack Digital Marketer can help teams build a stronger understanding of campaign strategy, audience targeting, and conversion funnels to evaluate true performance. For a deeper dive into maximizing your returns across the entire funnel.
Compare campaigns based on:
- Funnel stage
- Audience temperature
- Campaign objective
- Customer type
- Scale
- Acquisition economics
6. Check Attribution and Tracking Before Blaming the Campaign
This is one of the most important checks when ROAS suddenly changes.
Before asking:
“Why did advertising performance get worse?”
ask:
“Did the way performance is measured change?”
A sudden ROAS decline can come from measurement changes rather than actual business performance.
Possible causes include:
- Attribution-window changes
- Tracking-tag problems
- Conversion-event changes
- Missing purchase events
- Cross-device matching changes
- Platform reporting changes
- Duplicate or missing events
- Differences between platform-reported revenue and actual collected revenue
For example, if a platform previously attributed purchases using a longer attribution window and then the measurement rules changed, reported revenue may fall even if actual sales have not changed by the same amount.
Always reconcile three numbers
Platform-reported revenue
↓
Actual orders
↓
Revenue actually collected
If those numbers do not match, investigate the gap before changing the campaign.
7. Check Business Factors Outside the Ad Account
One of the biggest mistakes in ROAS analysis is assuming that every ROAS problem is an advertising problem.
It isn’t.
A campaign can remain relatively stable while business conditions change.
Check:
- Product availability
- Pricing
- Discounts
- Competitor activity
- Delivery timelines
- Fulfilment problems
- Refunds
- Cancellations
- Product mix
- Seasonality
- Website changes
- New-product launches
For example, imagine an ad continues generating purchases, but the advertised product goes out of stock.
The campaign may still receive clicks, but conversion falls.
Changing the creative would not solve the stock problem.
This is why ROAS should be treated as a signal, not a verdict.
A Simple 5-Point ROAS Drop Checklist
If you need to investigate a sudden ROAS decline quickly, start here:
| Check | Question to Ask |
| 1. Spend | Did spend increase faster than revenue? |
| 2. Conversion Rate | Did fewer visitors turn into customers? |
| 3. AOV | Are customers spending less per order? |
| 4. Traffic Cost | Did CPC or CPM increase? |
| 5. Tracking | Did attribution or measurement change? |
This first pass can help identify where the problem is occurring before you make campaign changes.
Use the SPARK Framework to Find the Real Cause
The five-point checklist is useful for quickly spotting changes. For deeper diagnosis, use the SPARK loop.
S — Spot the Unseen
Start with observation.
Do not immediately explain the change.
Write down what moved:
- Spend
- Revenue
- ROAS
- Conversion rate
- AOV
- CPC
- CPM
- Audience mix
- Product mix
- Attribution
For example:
| Metric | Before | After |
| Ad Spend | ₹1,00,000 | ₹1,80,000 |
| Attributed Revenue | ₹3,20,000 | ₹4,32,000 |
| ROAS | 3.2x | 2.4x |
| Conversion Rate | 3.4% | 2.6% |
| AOV | ₹800 | ₹740 |
The important point is that observation comes before explanation.
P — Probe the Obvious
Now create a hypothesis.
For example:
“ROAS fell because we expanded into colder audiences.”
That is a hypothesis, not a fact.
Validate it by checking:
- Prospecting versus retargeting performance
- Conversion rate by audience
- Landing-page conversion
- Product mix
- New-customer performance
- Acquisition cost
Avoid replacing one assumption with another.
The goal is to test explanations rather than accept the first explanation that sounds convincing.
A — Adapt Across Worlds
Look outside the immediate advertising metric.
A business may need a different way of evaluating customers depending on its model.
For example, a subscription business may accept a weaker first transaction because customers can generate revenue over several months.
A similar principle can apply to an acquisition campaign.
Instead of looking only at immediate ROAS, separate:
- New-customer ROAS
- Repeat-customer ROAS
- Customer acquisition cost
- Repeat purchase rate
- Customer lifetime value
This provides a more complete view of acquisition economics.
R — Reconstruct the Campaign Picture
Break the data into meaningful groups.
Instead of one blended ROAS number, separate:
- Prospecting
- Retargeting
- New customers
- Existing customers
- Audience segments
- Product categories
- Campaign objectives
This prevents one high-performing segment from hiding a weak segment—or a growing prospecting campaign from looking worse simply because it is being compared with retargeting.
K — Keep Iterating
Once you have a hypothesis, test it.
Avoid changing:
- Creative
- Audience
- Landing page
- Offer
- Budget
all at the same time.
If you change everything simultaneously and ROAS improves, you won’t know what caused the improvement.
Instead, make a controlled change where possible, measure the result, document what happened, and use the result to decide the next test.
What If ROAS Falls but Revenue Is Increasing?
A falling ROAS does not automatically mean revenue is falling.
Consider:
Campaign A
- Spend: ₹40,000
- Revenue: ₹2,40,000
- ROAS: 6x
Campaign B
- Spend: ₹3,00,000
- Revenue: ₹9,00,000
- ROAS: 3x
Campaign A has the higher ROAS, but Campaign B generates substantially more revenue.
The right analysis requires additional information:
- Contribution margin
- Customer acquisition cost
- New-customer volume
- Repeat purchases
- Lifetime value
- Incremental revenue
- Ability to scale
This is particularly important when moving from warm audiences into cold prospecting.
A lower ROAS can sometimes accompany greater customer acquisition and revenue scale.
When a Falling ROAS May Not Mean Something Is Broken
There are several situations where a lower ROAS needs additional context.
1. You are scaling into colder audiences
Your warm audience may have limited size.
Once you expand beyond it, efficiency can decline while customer volume increases.
2. You are investing in brand building
Brand-building activity may not immediately generate measurable direct-response revenue.
The effects can appear later through:
- Branded searches
- Direct traffic
- Larger retargeting audiences
- Repeat purchases
3. You launched a new product
A new product may have:
- Lower initial awareness
- Unproven messaging
- New creative
- An unoptimized funnel
- Limited historical data
Comparing it directly with a mature product can produce misleading conclusions.
Two ROAS Problems That Look Similar but Need Different Fixes
Example 1: High CTR but Low Conversion
Suppose:
- CTR = 2.8%
- Conversion rate falls from 3.5% to 1.8%
- ROAS declines
People are clicking.
The problem may be happening after the click.
Investigate:
- Landing page
- Offer
- Checkout
- Delivery promise
- Website speed
- Product availability
Replacing the creative immediately may solve the wrong problem.
Example 2: Low CTR but Strong Conversion
Now imagine:
- CTR falls significantly
- Landing-page conversion remains strong
- ROAS declines
Here the problem may be higher in the funnel.
Investigate:
- Creative fatigue
- Audience relevance
- Message
- Hook
- Placement
- Targeting
The same ROAS decline can therefore have completely different causes.
Don’t Forget Discounts
Discounts can create another misleading ROAS improvement.
Suppose a business introduces a 20% discount.
The discount may increase:
- Conversion rate
- Orders
- Revenue
- Reported ROAS
But if the discount reduces contribution per order significantly, the business may generate less economic value despite the better ROAS.
This highlights an important limitation:
ROAS measures revenue relative to advertising spend. It does not directly measure profit.
That is why ROAS should ultimately be connected to contribution and break-even economics.
The ROAS Diagnosis Tree
When ROAS falls, work through this decision path:
ROAS fell
↓
Did spend increase faster than revenue?
→ Check whether additional spend generated enough incremental revenue.
↓
Did the audience become colder?
→ Separate prospecting and retargeting.
↓
Did conversion rate fall?
→ Check landing page, offer, checkout, delivery and stock.
↓
Did AOV fall?
→ Check product mix, discounts and purchasing behaviour.
↓
Did CPC or CPM rise?
→ Check traffic costs, competition and placements.
↓
Did attribution or tracking change?
→ Reconcile platform data with actual orders and collected revenue.
This is a starting framework, not a rigid script.
10 Common ROAS Mistakes to Avoid
1. Assuming a ROAS drop means the creative is bad
Creative is only one part of the system.
2. Looking only at platform-reported ROAS
Platform revenue may not equal collected revenue.
3. Comparing prospecting with retargeting
They have different audiences and jobs.
4. Killing campaigns too quickly
Some campaigns need enough data and time to evaluate properly.
5. Ignoring seasonality
Performance can naturally change during holidays, festivals, launches and other seasonal periods.
6. Optimizing only for the highest ROAS
A small retargeting audience can produce high ROAS without providing enough scale.
7. Ignoring product and stock issues
A product problem can appear as an advertising problem.
8. Treating attribution changes as performance changes
A measurement change can make the chart move without an equivalent change in real sales.
9. Refreshing creative every time ROAS drops
First identify where the funnel is actually breaking.
10. Changing everything simultaneously
Multiple simultaneous changes make it difficult to identify what actually worked.
A Practical Example: Chennai Cook Box
Consider the Chennai Cook Box example.
The business increased advertising spend from ₹1,00,000 to ₹1,80,000.
Platform-reported revenue increased from ₹3,20,000 to ₹4,32,000.
As a result:
ROAS fell from 3.2x to 2.4x.
The initial reaction might be:
“The campaign is broken. Create new ads.”
But the diagnostic data showed more:
- Conversion rate fell from 3.4% to 2.6%.
- AOV fell from ₹800 to ₹740.
- The audience mix shifted toward colder prospecting.
- Spend increased substantially faster than attributed revenue.
The data therefore supported a testable hypothesis: expanding into colder audiences likely reduced conversion efficiency, while the lower AOV also contributed to the decline.
But that still does not prove that audience expansion was the only cause.
The team should validate the hypothesis through audience-level performance, landing-page data, order data and controlled testing.
There is another important point.
The platform-reported ROAS was already below Chennai Cook Box’s approximate 4.03x break-even ROAS based on the economics established earlier in the example.
So the central business question was not simply:
“Why did ROAS fall from 3.2x to 2.4x?”
It was also:
“Does the additional spending generate enough contribution and future customer value to justify the acquisition cost?”
Diagnosis explains why a number moved.
It does not automatically prove that the resulting economics are profitable.
What Should You Check First When ROAS Suddenly Drops?
If you only have a few minutes, use this order:
1. Check tracking and attribution.
Make sure the measurement itself has not changed.
2. Check spend versus revenue.
Determine whether spending increased faster than revenue.
3. Check conversion rate.
Find out whether the problem is occurring after the click.
4. Check AOV.
Determine whether each customer is generating less revenue.
5. Check CPC and CPM.
See whether traffic became more expensive.
6. Check audience mix.
Separate cold prospecting from warm and hot audiences.
7. Check the business.
Review stock, pricing, discounts, fulfilment, seasonality and product mix.
Only after these checks should you decide whether the creative, audience, landing page, offer or budget needs to change.
Final Takeaway
A sudden ROAS drop is a diagnostic signal, not an automatic instruction to pause campaigns or replace creative.
The fastest way to understand it is to determine what changed first:
- Spend
- Revenue
- Conversion rate
- AOV
- CPC
- CPM
- Audience mix
- Attribution
- Tracking
- Business conditions
Then use the SPARK framework — Spot, Probe, Adapt, Reconstruct, Keep Iterating — to move from observation to a testable explanation.
The most important habit is simple:
Don’t jump from “ROAS fell” to “the ads are bad.” Find where the economics or measurement actually changed first.
A campaign can have a falling ROAS because the audience became colder, the funnel weakened, AOV declined, traffic became more expensive, tracking changed, or the underlying business changed.
The number tells you that something changed.
Good ROAS analysis helps you discover what changed, why it changed, and what should be tested next.
Frequently Asked Questions About a Sudden ROAS Drop
- Why did my ROAS suddenly drop?
ROAS can suddenly drop because of higher ad spend, lower conversion rates, lower AOV, higher CPC or higher CPM, colder audiences, product or stock issues, seasonality, discounts, or attribution and tracking changes.
The first step is to identify which underlying metric changed at the same time as ROAS.
- What should I check first when ROAS drops?
Check tracking and attribution first, followed by spend versus revenue, conversion rate, AOV, CPC/CPM and audience mix.
This helps determine whether the decline is a measurement issue, traffic issue, conversion issue or business issue.
- Does a lower ROAS always mean my ads are performing worse?
No. A lower ROAS can occur when a campaign expands into colder audiences or increases scale.
The correct interpretation depends on revenue, contribution, customer acquisition, lifetime value and the campaign’s objective—not ROAS alone.
- Why did my ROAS drop after increasing my budget?
Increasing the budget can move delivery into larger or colder audiences where conversion efficiency is lower.
However, the budget increase itself does not automatically cause a ROAS decline. Compare the percentage increase in spend with the percentage increase in attributed revenue and examine performance by audience segment.
- Can ROAS drop even when sales increase?
Yes.
If advertising spend increases faster than attributed revenue, total sales can rise while ROAS falls.
For example, moving from ₹3,20,000 revenue on ₹1,00,000 spend to ₹4,32,000 revenue on ₹1,80,000 spend increases revenue but reduces ROAS from 3.2x to 2.4x.
- Why is my CTR good but my ROAS low?
A strong CTR with a low ROAS can indicate that people are interested enough to click but are not converting after the click.
Check the landing page, offer, checkout, website speed, delivery information, product availability and pricing before assuming the creative is the problem.
- Why is my conversion rate good but my ROAS falling?
If conversion rate remains strong but ROAS falls, investigate AOV and traffic costs.
Higher CPC or CPM can make each customer more expensive, while a lower AOV means each customer generates less revenue.
- Can attribution changes cause a sudden ROAS drop?
Yes. Changes to attribution windows, tracking, conversion events, platform measurement or cross-device matching can change reported attributed revenue.
Always check whether measurement changed before concluding that actual advertising performance deteriorated.
- Should I pause my campaign if ROAS suddenly drops?
A sudden ROAS decline alone does not provide enough information to make that decision.
First determine whether the decline is caused by tracking, audience mix, conversion rate, AOV, traffic costs, seasonality or another business factor. Then compare the result against the campaign’s actual economic objective and break-even requirements.
- What is the SPARK framework for ROAS analysis?
SPARK is a diagnostic framework:
- S — Spot: Identify what changed.
- P — Probe: Form and test hypotheses.
- A — Adapt: Consider lessons from different business contexts.
- R — Reconstruct: Break performance into meaningful segments.
- K — Keep Iterating: Run controlled tests and learn from the results.
It helps marketers avoid reacting to a falling ROAS number without understanding its cause.
- Should I change my creative when ROAS drops?
Not automatically.
If CTR is healthy but conversion rate has fallen, the problem may be after the click. If CTR has declined while conversion remains strong, creative, audience relevance or messaging may deserve closer investigation.
The data should determine what you test next.
- Why can ROAS improve while profit gets worse?
ROAS measures revenue generated relative to advertising spend, not total profit.
A discount can increase conversions and revenue while reducing contribution per order. Therefore, a higher ROAS does not necessarily mean the underlying economics improved.
- What metrics should I monitor alongside ROAS?
Useful supporting metrics include:
- Ad spend
- Attributed revenue
- Conversion rate
- CTR
- CPC
- CPM
- AOV
- Customer acquisition cost
- New-customer volume
- Repeat purchase rate
- Contribution per order
- Customer lifetime value
- Actual collected revenue
Together, these metrics provide more diagnostic information than ROAS alone.